Quadratic Functions
§5.10 The Area under the Curve of Quadratic Functions
Since the area under a parabolic graph has a curved boundary, it is diffi-
cult to get an exact area, so we will develop a technique to approximate this
area.
The technique will be the following: To get a good approximation of the
area under a quadratic function y = f(x), between x = a and x = b:
1. Print out a good Maple Graph of y = f(x) between a and b.
2. Partition the x-axis between a and b into n-equal segments, where n is
arbitrarily chosen.
3. Above each segment “estimate” the height of the rectangle whose area
is equal to the area under the curve.
4. Add up the heights.

Example 1 Find the area under the curve of f(x) = x2 − x between 1 and
3, using 4 intervals (n = 4)).
In this case the length of each interval is

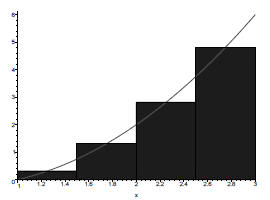
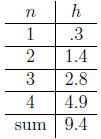
An estimation of the heights of each rectangle could be
Since we want to compute the total area, we should multiply each height
by the width of the rectangle which is .5, and then add the areas. But since
each rectangle has the same width we can save ourselves some computa-
tion by adding the heights and then multiplying by the width last. In this
example we have saved ourselves three multiplications! In general we save
n−1 multiplication steps by multiplying the width after adding the heights,
instead of before.
So now we multiply (9.4)(.5) = 4.7, which is our estimated area.
Example 2 Find the area under the curve of f(x) = x2 − 1 between -1 and
2, using 6 intervals (n = 6)).
We first compute 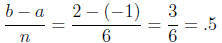
Now we look at the partitioned graph.
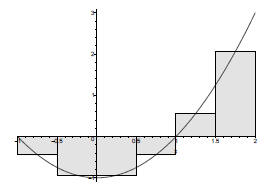
An estimation of the heights may be:
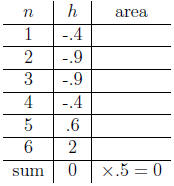
In this example the area under the x-axis is apparently the same as the
area above the x-axis, hence the total signed area is 0.
§5.11 The Inverses Quadratic Functions
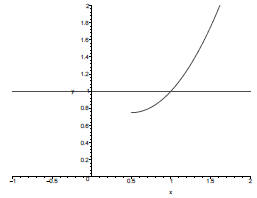
A quick look at the graph of a quadratic function with the “Horizontal
line test ”:
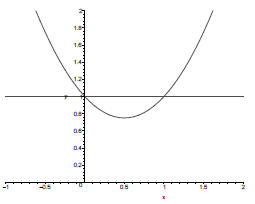
Shows that the function is not 1-1, and hence has no inverses over its
entire domain. However if we restrict its domain to just those values to the
right (or left) of the vertex we will have a function that is 1-1. And since
every function is onto its image, if we restrict its range to its image it will
also be onto.
Example Find the domain and range over which the function f(x) = x2−2x
has an inverse, and determine what the inverse is.
First we find the vertex by completing the square.
f(x) = x2 − 2x = x2 − 2x + 1 − 1 = (x − 1)2 − 1.
Thus the vertex is (1,−1) So the domain would be [1,∞). Since the
graph opens up the range would be [−1,∞).
Now to find the inverse we set the function in its completed square form
equal to y, and solve for x .
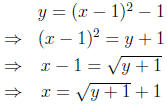
Recall the the range of the inverse function is the domain of the original
function, thus when we extracted the square root we knew we should take the
positive square root, since the domain of the original function was positive.
Since y represents the domain value of the inverse function we rename y
to be x and we have the inverse function 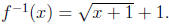
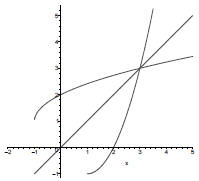
We can verify the validity of this inverse by comparing the graphs
§5.12 Modelling Quadratic Functions
Suppose you collected the following data:
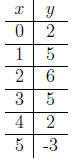
Using a spread sheet such as excel you can plot these points and look at
the graph that they would describe.
From the graph it appears that it is a quadratic function. Quadratic
functions are of the form y = ax2 + bx + c. To determine which quadratic
function we must determine the values of a, b, and c. To do this we choose
three points from our data set and substitute the values into our general
equation. Lets pick the points (0,2), (1,5) and (2,6).
2 = 0a + 0b + c (1)
5 = a + b + c (2)
6 = 4a + 2b + c (3)
From equation 1 we see that c = 2. Substituting c=2 into equations (2)
and (3) and multiplying equation (2) by 2 we get
6 = 2a + 2b (4)
4 = 4a + 2b (5)
Now subtracting equation (5) from equation (4) we get
2 = −2a  a = −1
Substituting -1 for a into equation (4) we get 8 = 2b
 b = 4. Thus our
quadratic function is
f(x) = −x2 + 4x + 2.
| Prev | Next |