Principles of Microeconomics
1. Math Review :
There are two types of curves that you have to know in this course.
•Line: described by linear function and constant slope
•Non- linear curve : slope changes with the value of x.
1.1 Linear Function :
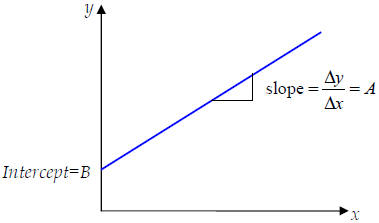
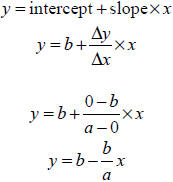
y = intercept + slope  x
x
y = B + Ax
where A is intercept and B is slope .
In the x-y space, we can draw the above linear equation as
Suppose that two points where the line pass are given, how can we find the
linear
function?
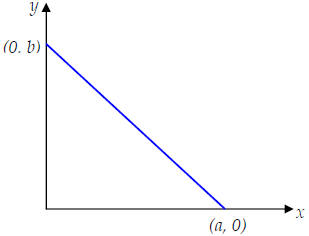
We can obtain the linear function by following procedure.
Slope value B decides the characteristics of the straight lines:
• If B>0, the straight line is upward sloping, and the relation between x and y
is positive .
• If B=0, the straight line is horizontal. (y = constant)
• If B<0, the straight line is downward sloping, and the relation between x and
y is negative.
Summary (the procedure of finding the linear function)
• Step1: by using two different points , find the slope.
• Step 2:by using the slope and one specific point (x,y), find the intercept.
Exercise 1: Which of the following linear equations passes through the
coordinates (y = 8, x = 3) and (y = 0, x = 27)?
a) 3x = 27 - y
b) 3y = 27 – x
c) x = 9 + y
d) x = 9 - y
Exercise 2: Let the horizontal axis be the X variable and the vertical
axis be the Y
variable . There are two points. Point A has a value of X of 2 and a value of Y
of 2 while
point B has a value of X of 4 and a value of Y of 6.
a) Draw a straight line passing through both points.
b) Give the equation of that line.
c) Indicate the slope and the X and Y intercepts of that line.
d) Now consider another line: Y = 7 – X. Draw this second line in the graph that
includes the former line.
e) Solve algebraically for the intersection of these lines.
1.2. Non-linear function
y = f (x)
Slope changes with the value of x.
How can we draw the non-linear curve?
→Find several points where the non-linear curve pass .
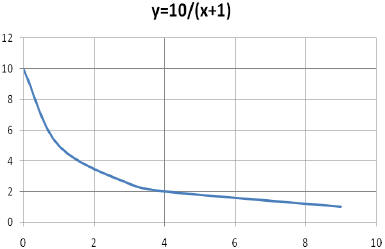
Example: y=10/(1+x)
Step 1: Pick several values of x. Consider x=0, 1, 3, 4, 9.
Step 2: Find the corresponding values of y.
•If x=0, y=10/(0+1)=10
•If x=1, y=10/(1+1)=5
•If x=3, y=10/(1+3)=2.5
•If x=4, y=10/(1+4)=2
•If x=9, y=10/(1+9)=1
Step 3: connect these points.
2. Production Possibility Frontier (PPF)
The Production Possibility Frontier (PPF) illustrates the trade-offs facing an
economy
that produces two goods. It shows the maximum quantity of one good that can be
produced given the quantity of the other good produced.
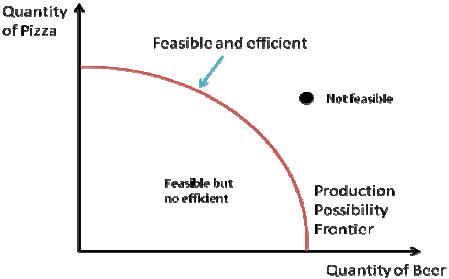
There is a crucial distinction between points inside or on the curve and outside
the curve.
• Inside or on the curve: feasible
• Outside the curve: not-feasible
The concept of efficiency: an economy is efficient if there are no missed
opportunitiesthere
is no way to make some people better off without making other people worse off.
Exercise 3: John produces two goods, cheese (C), and wine (W). If he does
not produce and
cheese, he could produce 40 bottles of wine. For each piece of cheese he wants
to produce, he needs
to give up at least 2 bottles of wine.
1. Graph the production possibilities frontier.
2. Can he produce 20 bottles of Wine and 5 pieces of cheese? Is it efficient?
3. What is the maximum number of bottles of wine he can produce if he decides to
produce
4 pieces of cheese?
3. Comparative Advantage and Gains from Trade
Opportunity cost: what you must give up in order to get a good or service.
•Comparative advantage
•Absolute advantage
An individual has a comparative advantage in producing a good or service if the
opportunity cost of producing the good is lower for that individual than for
other people.
An individual has an absolute advantage in an activity if he/she can do it
better than other
people.
Remark: having an absolute advantage is not the same thing as having a
comparative
advantage.
Gains from the trade: the mutual gains that individuals can achieve by
specializing in
doing different things and trading with one another.
John and Steven work 12 hours a day to make coffee and cola. The following table
shows
how long it takes each of them to make each good.
| John | Steven | |
| Coffee | 2 hours | 6 hours |
| Cola | 4 hours | 1 hours |
How can we compute the opportunity cost?
Let’s consider the opportunity cost of coffee. To make one cup of coffee, John
needs to
work 2 hours and Steven needs to work 6 hours. If John uses these two hours to
make
cola, he can make 1/2 cola. Thus, the opportunity cost of one cup of coffee for
John is
1/2 cans of cola. On the other hand, if Steven spends 6 hours to make cola, he
can make
6 cans of cola. Thus, the opportunity cost of one cup of coffee for Steven is 6
cans of cola.
Thus, John has a comparative advantage in making coffee because his opportunity
costs
of making coffee are lower than Steven'.
When they specialize in what they are good at and trade, they will be better
off.
Since John makes coffee better than Steven and Steven makes cola better than
John, we
suppose that John specializes in coffee and Steven does in cola.
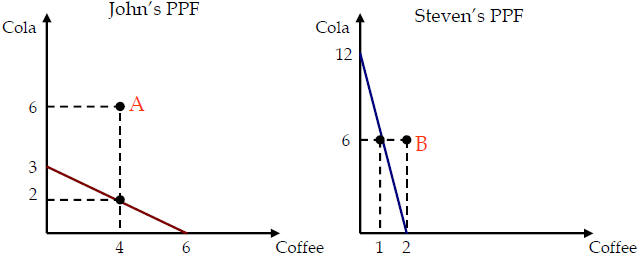
Then, John produces 6 cups of coffee and Steven produces 12 cans of cola. If
John gives 2
cups of coffee to Steven and Steven gives 6 cans of cola John, this make them
consume
cola and coffee outside their respective PPF.
| Prev | Next |