Tools for Solving Equations
Review: ABS Inequalities
Every inequality containing only one absolute value can be
split into a compound inequality .
|x| < a  −a < x < a
and
|x| > a  x > a or x < −a
Think about why < is an AND while > is an OR.
Review: Graphical Inequalities
It is easy to think about this in terms of a graph if you get
everything on one side and a 0 on the other. For example,
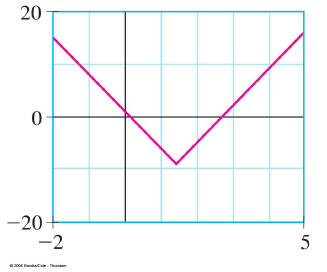
turn |7x − 10| ≤ 9 into |7x − 10| − 9 ≤ 0 and then graph
y = |7x − 10| − 9
Review: Quadratic Inequalities
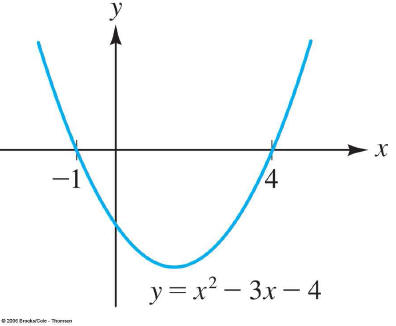
To solve a quadratic inequality, first make one side equal to
zero .
Then graph the equation when you make the zero y. For
example x2 − 3x − 4 > 0
Review: Solving with Key Numbers
Between key numbers, the sign of an expression will not
change.
Using this fact, we can solve the inequality 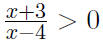
§3.1: Functions
A Relation is any way to take an x and find a y.
A Function is a relation where each x produces one, and
only one, y.
The Domain of a function are all of the x’s that are allowed
to be used.
The Range of a function are all the possible y’s that could
come out.
Finding the Domain
When you are fining the domain of a function, there are 2
possible problems:
1. You can’t divide by zero .
2. You can’t take the square root of a negative number .
So the domain of f(x) = 1/x is R except 0.
The domain of 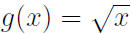 is non-negative elements of R
How to answer these Questions
For example:
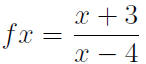
Clearly x − 4 ≠ 0 so x ≠ 4
You could answer with the English statement “The domain
is all real numbers with the exception of 4”
Alternatively you could write:
R − {4}
How to find the Range
To determine the range of a function, say y = x2, solve for x.
For what y’s can you find x’s?
In this case, you can find x’s only for y’s bigger than or
equal to 0, so the range is all non-negative numbers in R .
We will learn an easier way to find the range in the next
section.
What is the range of ?
?
§3.2 The graph of a function
The graph of a relation is just all of the plotted points (x, y)
where x is related to y.
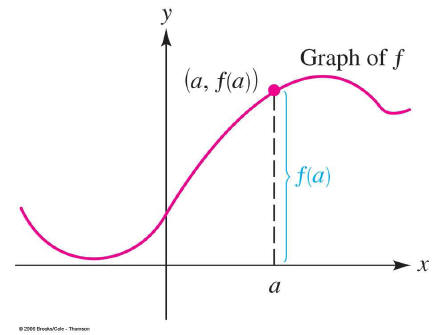
The graph of a function is just all of the plotted points (x, y)
where f(x) = y.
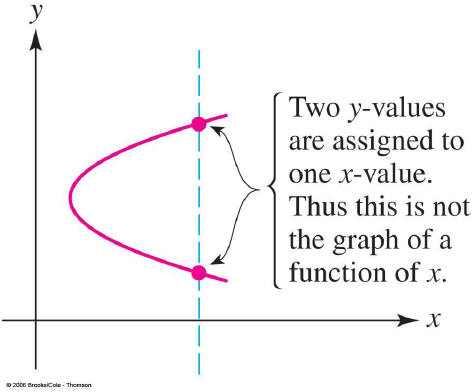
The Vertical Line Test
If a graph represents a function, it will pass the vertical line
test.
Using a Graph to find Domain, Range
Simply scan across to find the values where the function is
not defined at x. This is the domain.
Then scan up to find the values where the function is not
defined at y. This is the range.
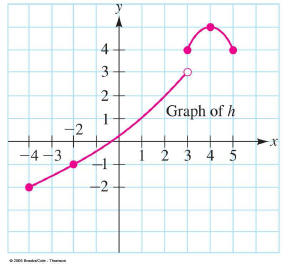
So the domain is [-4,5] and the range is [-2,3) with [4,5].
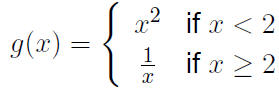
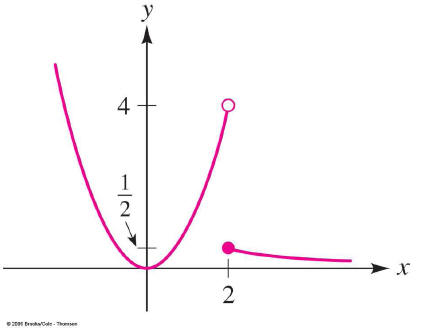
Graphing a piece-wise defined Function
Graph
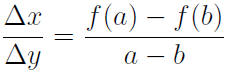
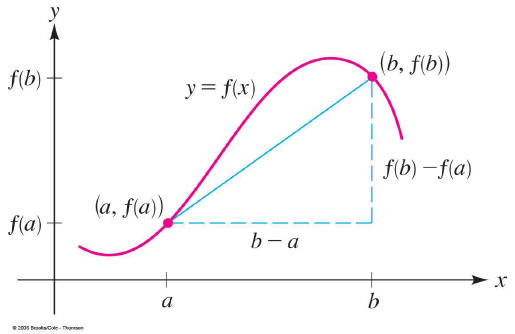
§3.3 Rates of Change
The average rate of change between a and b for a function
f(x) is
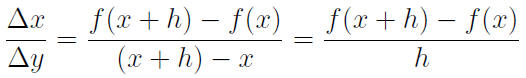
Approaching Real Rates of Change
The average rate of change between x and x + h when h is
small will be very close to the actual rate of change at x.
Examples:
#9
#23(a and b)
| Prev | Next |