The Myth of Objectivity in Mathematics Assessment
DISCUSSION
In educational assessment—the myriad processes
by which humans try to determine what other
humans “know”—objectivity is a term that simply
does not apply. Alternatively, we can strive for
“agreed-on subjectivity.” The following two specific
suggestions can help improve the consistency and
usefulness of assessment information gathered by
teachers.
First, design classroom assessment tasks that
are likely to elicit the information that you seek.
Ask yourself the following questions: What is the
mathematics that I am trying to assess here? What
tasks will tap this mathematics most directly? A
teacher of second-year algebra might want to know
what students understand about quadratic equations
and the techniques for solving them . The
question in the previously discussed example—consisting
of the one-word imperative “solve”—does not
directly ask students to supply much information
about their understanding. The set of tasks in figure
7, for example, does so more specifically. Greer
et al. (1999) offer guidelines for creating and adapting
tasks for classroom assessment.
No single
instrument
is likely to
measure
knowledge
in any
consistent
and
meaningful
way
| a) Use one of the symbolic methods that were developed in class to find solutions to the equation x2 + x – 6 = 0. b) Explain the method that you used in part (a). c) Use the graph of a function to illustrate the solutions that you found in part (a). d) Finding no real solutions to a quadratic equation is possible . Explain how this result could happen. Give an example that illustrates your explanation. Fig. 7 A revised quadratic-equation task |
Second, before assigning any task to students,
devise—and share with the students—guidelines
for scoring their work. See Thompson and Senk
(1998) and Greer et al. (1999). Ask yourself what
types of responses you are likely to get from students
to these tasks and what you will accept as
evidence of adequate understanding. Thinking
these questions through before giving the tasks to
students helps clarify the tasks themselves. It also
helps align the tasks with the in-class instruction.
Sharing these guidelines with students communicates
expectations and makes meeting them more
likely. One set of guidelines for scoring student work
on the tasks in figure 7 is proposed in figure 8.
CONCLUSION
Such false dichotomies as “objective versus subjective”
and “traditional versus alternative” derail
Teachers
should
consider
ways to make
assessment
more
consistent
and useful
| 5 – All the characteristics of 4, plus either a valid example with a clear explanation for part (d) or exceptional responses to parts (a) through (c) along with a response to part (d) that might have some minor flaws. 4 – Correct responses to parts (a) through (c): correct equation solutions, along with a valid explanation of the method; sketch of graph with all important features correct and labeled. 3 – Substantial evidence of understanding of quadratic equations: some minor errors (not central to understanding quadratic equations) are the only information that is missing from the characteristics of a 4. - - - - - - - - - - - - - - - - - - - - - - - - - - - - 2 – Some evidence of understanding of quadratic equations is present: either a symbolic solution or a graphical illustration, perhaps with some minor errors. 1 – Little understanding of quadratic equations is shown: major errors in all parts of the problem. 0 – No attempt made. Fig. 8 A scoring rubric for the revised task |
meaningful discussions of the important issues in
mathematics assessment. The labels “traditional”
and “alternative” are meaningless; a five-question
classroom quiz can give detailed information about
what students know, or it can furnish very little
information, depending on how it is designed,
scored, and used. No “objective” assessment occurs;
subjective—that is, human—knowledge, beliefs,
judgments, and decisions are unavoidable parts of
any assessment scheme. Teachers should consider
ways to make assessment of students’ mathematical
understanding, as well as the information gathered
through that assessment, more consistent and
useful.
APPENDIX
Computing the measurement error and confidence
interval around test scores depends on the concept of
reliability. The reliability of a test is an answer to the
question, How accurately does this test measure what
it intends to measure? In other words, if the test is
administered many times to the same student, how
close will the results be? If we gave the test to two students
who possess the same amount of the knowledge
or ability being measured, how close would the scores
be? As another example, if we were discussing the
reliability of a thermometer, we would ask how close
thermometer readings are to the actual temperature
and how consistently the thermometer produces these
readings.
One way to determine the reliability of a test is to
correlate students’ scores on repeated administrations
of that test. A perfectly reliable test—one that reports
students’ true scores with no error—would have a
“test-retest” reliability
![]() 1. However, no test
is
1. However, no test
is
perfectly reliable. If you could repeatedly administer a
test, the set of scores for a particular student would be
distributed around the student’s true score. See figure
A-1. The more reliable the test, the higher the
test-retest correlation and the tighter the distribution
of scores. For the very reliable SAT-I Mathematics
test, ![]() = 0.91.
= 0.91.
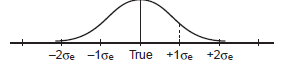 Score Fig. A-1 |
The standard deviation of this distribution of scores
is the standard error of measurement,  . It
can be calculated
. It
can be calculated
using the standard deviation of the test
scores,  , and the test’s reliability,
 , using
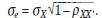
For the SAT-I Mathematics test,
 and
and 
0.91, so
Therefore, for this student, 68 percent of the scores
that she would earn if she were to take the test
repeatedly would be within thirty points on either side
of her true score. Similarly, 95 percent of her scores
would be within sixty points on either side of her true
score.
Imagine that the test could be administered repeatedly
to two different students. If the difference
between these two students’ scores is computed every
time that the test is administered, these difference
values would also lie on a distribution, this time
around the true difference score for these students.
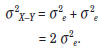
Because the distributions of the two scores are independent,
the variance of this difference distribution is
equal to the sum of the two individual variances:
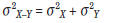
For the SAT-I Mathematics test,

so
Therefore, the “standard error of the difference”
between two SAT-I Mathematics test scores is

To be 95 percent sure that two actual scores represent
different true scores, the actual scores would have to
differ by at least eighty -four points.
| Prev | Next |