Graphical Representations of Sys
Graphical Representations of Systems of Linear Equations
One of the great advantages of teaching with the computer
is the quick and easy
access to the graphical representations of algebraic equations . In many
situations, the
graph offers much more insight into the problem than does the algebra. This
module
concerns a group of problems for which the graphs offer not only the insight
into the
solution, but pose the problems as well.
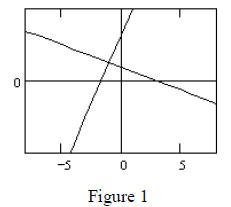
We will first consider a system of linear equations in general form, ax + by = c
,
where a, b, and c are in arithmetic progression . One example is 2x + 4y = 6 .
Another is
3x - y = - 5. If we graph these two equations (Figure 1), it is not surprising
that they
intersect, since the slopes of the lines are different .
If we now add to the system several more equations, as indicated in Figure 2, we
quickly see that something special, possibly surprising, is happening; something
that is not
obvious from looking at the equations.
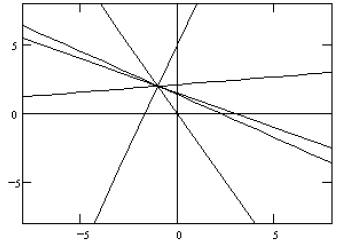
Figure 2
It is a simple task to solve the system to determine that the point (- 1, 2)
lies on all linear
equations in general form whose coefficients form an arithmetic progression. Why
should
this be so? If you consider the form of these equations, ax + (a + k) y = a + 2k
, the
answer is clear. The right side of the equation has 2k, while the only term with
k on the
left side is associated with y. For the two sides to be equal, y must equal 2.
But if y = 2 ,
then on the left side we have ax + (a + k) 2= a + 2k , and x must
equal - 1. The important
aspect of this problem is that the geometry of the system, not the algebra, was
the
interesting and surprising part.
The next question to consider is, what happens if you try other patterns for a,
b, and c?
Suppose we consider the system of linear equations in general form ax + by = c ,
where a,
b, and c form a geometric progression. What geometry does this system have? If
you
begin by graphing equations of this form, there seem to be intersections all
over the plane.
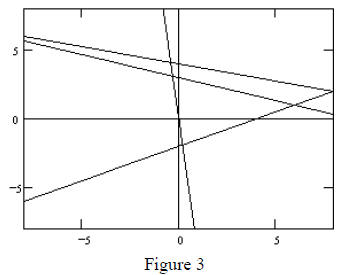
However, as more equations are graphed, something in the
graph begins to take shape.
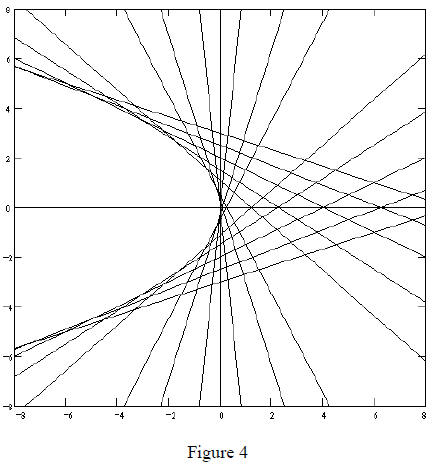
Notice that there is a region in the plane which has no intersections! What
region
is this, and from where does it come? Solving the general system ax + ary = ar2
and
bx + bsy = bs2 gives solutions of x = - rs and y = r + s . How do
these values of x and y
determine the "null" region in the plane? Students can play with the graph and
guess the
boundary for the region. It appears to be a parabola of the form y2 =
- kx , for some
positive number k. Trying several values of k, students will quickly see that k
= 4 gives a
good fit.
This boundary curve can be determined analytically by considering the equation
ax + ary = ar2 as a quadratic function of r. Then r2 - yr
- x = 0 . Solving for r, we find
that 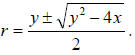 Notice that no r exists for which y2
- 4x < 0 . This means that no
Notice that no r exists for which y2
- 4x < 0 . This means that no
linear equation of the form ax + ary = ar2 passes through the region
defined by y2 < - 4x .
Notice that the two solutions x = - rs and y = r + s
satisfy this condition. That is, (r + s)2 ≥-4(-rs) . To see this,
combine all terms so that
r2 + 2rs + s2- 4rs ≥ 0, and notice that the left side of
the equation is a perfect square
r2 -2rs+s 2 = (r-s)2which is always greater
than or equal to zero. The boundary for
the "null" region seen in Figure 4 is y2 = - 4x . Again, there is
nothing in the algebraic
representation of this system to indicate something quite spectacular is
happening. Both
the problem and its solutions are motivated by the graphics.
Other similar questions naturally follow. Determine and explain the solution
patterns defined by considering the system ax + by = c , where a, b, and c are
defined by:
1. a ×b = c , for differing values of c . eg. 2x + 5y = 10 , 3x - 4y = - 12 ,
and 6x + y = 6
2. fix c, ( c = 48 , for example) and a ×b = c . eg 4x + 12y = 48,
- 3x - 16y = 48 , and 12x + 4y = 48
3. a2 + b2 = c2
4. 
5. What figures are created if x is replaced by x2 in these
equations?
| Prev | Next |