TI-89 WORKSHEET 5:Algebra Concepts
The TI-89 can graph many different types of
equations. The following four examples
illustrate different types of equations graphed
on the TI-89. In these examples, the function
must be rewritten to be a function of x. The
examples demonstrate how to use the solve
feature of the calculator to rewrite the function
before graphing.
Example 1:
Graph the following equation.
3y – 9x = 15
First, change from standard form to slope-intercept
form by using the solve function :
Step 1: Press „ followed by 1 to access the
“solve(” function and press ¸ .
.
Step 2: Type in the above equation and then
push the enter key. ¸ .
.
Step 3:
 Enter the above equation into the
y -editor for y1=. (If you know how to copy and
paste, this process can be simplified )
Step 4: Check for an appropriate viewing
window to graph the equation.
You may also consider using the F2 ZOOM tab on
the top of the y-editor screen:
 and
and
then type
 (alpha =) or press
 and scroll
down to option A: in order to select “ZoomFit”,
which establishes a window of best fit for viewing
the graph.
Choosing the “ZoomFit” option will automatically
take you to the graph. Therefore, step 5 is only
necessary to go directly from the y-editor to the
graphing screen.
Step 5:
 Graph the equation.
Example 2: Graph the following equation
y = x2 + 2x − 4
Step 1:
 Enter the above equation into the
y-editor for y2=.
Step 2: Highlight y1 and press
 This will
remove the check mark and instruct the
calculator to only graph y2.
Step 3:
 Graph the equation.
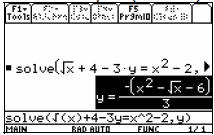
Example 3: Graph the following equation
First, this must be written as a function of x.
Therefore it must be solved for y .
Step 1: From the home screen select

Step 2: Type in the equation. Type in a
comma and then a y. Finish by typing a close
parenthesis and press enter.
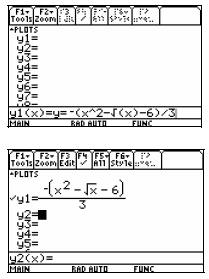
Step 3: Use your arrow keys to highlight the
answer. Press
 to copy the answer.
Step 4: Press
 to access the equation
editor screen. Using
 paste the
answer in y1. The answer will appear in the
entry line . It is important that the extra y= is
deleted before you hit enter.
Step 5:
 Graph the equation.
| Prev | Next |