Linear Equation
Recall:
• When we studied scatter plots , we used MS Excel to graph a ‘trendline’ to find
the best line through
the data points.
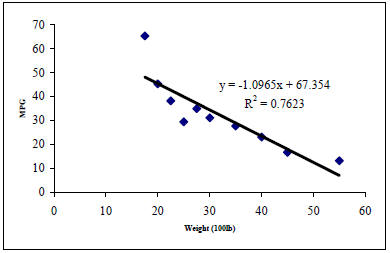
• We see from the line above that as the weight of the car
increases, the MPG decreases.
• In fact, if we look at the equation we see it is y = –1.0965x + 67.354
• The slope of the line (–1.096, the number in front of the x) represents the
relationship between the
variables weight and MPG. So as the weight increases 1 unit (100 lbs) the MPG
decreases by 1.0965.
• The graph of this line represents a linear relationship between weight and
MPG.
Background:
• The symbol Δ (read delta) represents a change in a quantity .
• So Δx represents the change in x . It is found by
Δx = end value – starting value
• So if weight (x) goes from 400lbs to 700lbs, the change in weight ( Δx ) would
be
Δx = 700 − 400 = 300 lbs
• Δx does not represent multiplication !
Equation of a Line:
• 
• If we have the equation , then we have
m = 2 and b = 4
• The letters x and y are variables, meaning they vary or change along
the line. At least one of them
must be nonzero. Together they represent the ordered pairs (x, y) on the graph.
• The equation ![]() is a
rule that assigns a y for any x we put into the equation.
is a
rule that assigns a y for any x we put into the equation.
• So, we can put x = 3 into the equation like so …
• And we get out a 10. This means that (3, 10) is a point
on the graph of the line. We can also write
y(3) = 10
• We can find other values from by plugging in different values of x
• Putting together these (and other) points, we can graph
the line ![]() it would
look like the
it would
look like the
following…
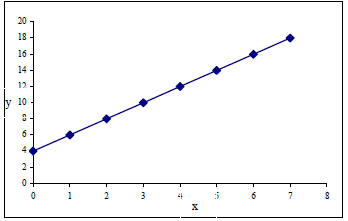
• Notice that the first point on the graph is (0,4) and
the second is (1,6), and so on.
• Usually y depends on the value of x. So x is graphed on the horizontal and y
on the vertical.
• m represents the slope of the line . In our example above, the slope is 2.
• b is the y-intercept, or where the line crosses the y axis. In our example
above, the y- intercept is 4.
The Slope:
• m, the slope of the line can be positive or negative , large or small.
• It is a measure of 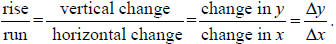
.
• Let’s find the slope of the line between the points (1,6) and (3,10). Notice
these are points on our
example line above.
• This would be true for any two points on the line. Try it for (3,10) and (7,
18)
Generating a Table and Graph from an Equation:
• Generate a table and graph for 
When x = 0,  . This is Line 1 on our table,
and the point (0,1) on the plot
. This is Line 1 on our table,
and the point (0,1) on the plot
When x = 2,  . This is the Line 2 on our
table, and the point (2,7) on the plot.
. This is the Line 2 on our
table, and the point (2,7) on the plot.
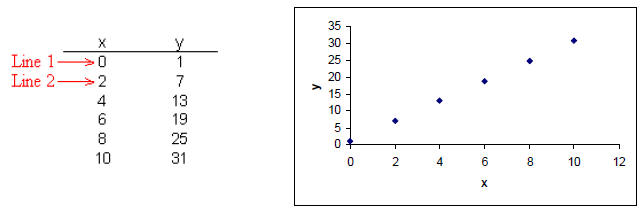
Verify the rest of the points and then draw a line through
them.
• Notice that for the above problem, the slope (m) is 3, the y-intercept
(b) is 1.
Determining Linear Relationships:
• There are several ways to determine a relationship is linear
− The graph (picture) is a line
− The equation is given and it is linear in form (y = mx + b)
− You are told something increases (or decreases) by a constant or fixed amount
| Prev | Next |