Math 1351 Test #1 Review
1. It is possible for the difference of two fractions to be a whole number.
A) True
B) False
2. Express (-128)2/7 without exponents
3. Express 272/3 without exponents.
4. Write without exponents : 25-3/2
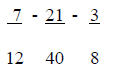
5. Calculate the following and express your answer in simplest form .

6. Perform the following subtractions. Express your answers in simplest form.
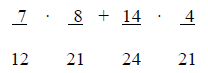
7. Perform the following computations. Express your answers in simplest form.
8. The sum of two irrational numbers can never be
rational.
A) True
B) False
9. If x^2 = 5, then which is true?
i) x is a rational number
ii) x is a real number
A) (i) only
B) (ii) only
C) Both (i) and (ii).
D) None of the other choices.
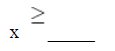
10. Solve for x : -5x - 2 ≤ -14 + 2x. (Write your answer as a fraction in lowest terms.)
11. Solve for x:
3x - (2 - (4x + 7)) = 19.
Answer: x = _____
12. Solve the following equations for x :
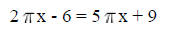
Answer: x = _____ / π
13. Is  rational or
irrational? _____
rational or
irrational? _____
14. A function f(x) = mx + b is a linear function .
A) True
B) False
15. A horizontal line test can be used to determine if a
graph is that of a function .
A) True
B) False
16. The coordinates of the point shown are
i) (0, 2)
ii) in quadrant I
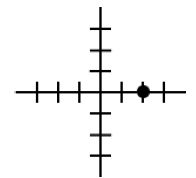
A) (i) only
B) (ii) only
C) Both (i) and (ii).
D) None of the other choices.
17. Which of the following is the graph of a function?
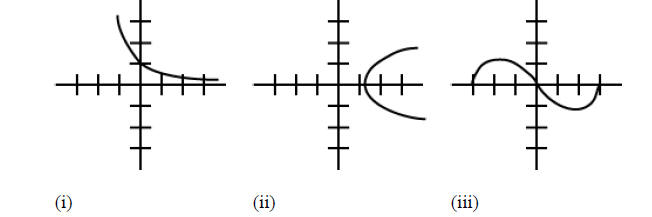
A) (i) and (ii)
B) (i) and (iii) only
C) (ii) and (iii) only
D) (i), (ii) and (iii)
18. Find the coordinates of points A, B, C, D, and E.
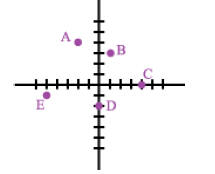
A = ( _____ , _____ )
B = ( _____ , _____ )
C = ( _____ , _____ )
D = ( _____ , _____ )
E = ( _____ , _____ )
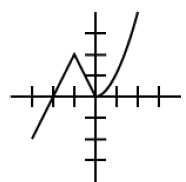
19. The graph of f(x) is shown below. For which value (s)
of x is f(x) = 0? Write your
answer as a list of numbers, separated by semicolons.
20. Circle graphs are useful for showing trends but less
useful for comparing parts of a
whole.
A) True
B) False
21. Pictographs can be used to mislead by displaying two
dimensions when only one of the
dimensions represents the data.
A) True
B) False
22. Which of the following graphs does not display trends
as well as the others?
A) circle
B) bar
C) line
D) pictograph
23. Which of the following is the best way to represent
the percentage of people working in
various occupations in a certain city?
A) Dot diagram
B) Circle graph
C) Line graph
D) None of the other choices.
24. What was the percent increase in population in Cairo? (Omit the "%" sign.)

25. The mean of the data -5, -3 , -1, 1, 3, 5 is 0.
A) True
B) False
26. The variance of the data -2, 0, 2 is 0.
A) True
B) False
27. Every large group of data has a normal distribution.
A) True
B) False
28. What is the median of the following list of numbers?
1, 5, 3, 5, 7, 8, 2, 4
A) 5
B) 4.5
C) 4.375
D) None of the other choices.
29. The mean of the numbers 24, x, 27, 31, 37 is 28. What
is x?
A) 26
B) 25
C) 21
D) None of the other choices.
30. Which collection of data has a mean of 12 and a
variance of 0?
i) 12, 12, 12, 12, 12
ii) -12, -12, -12, 48, 48
A) (i) only
B) (ii) only
C) Both (i) and (ii).
D) None of the other choices.
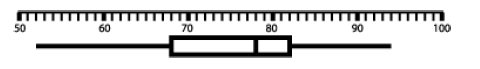
31. Use the box and whisker plot to answer the following
question:
What is the median?
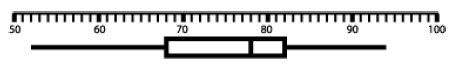
32. Use the box and whisker plot to answer the following question:
What percentage of students scored between 53 and 68?
(Give your asnwer as a single
number, omitting the "%" sign.)
33. Calculate this student's weighted average if tests are
weighted 65%, quizzes are
weighted 15% and the final is weighted 20% of the average. (Omit the "%" sign
from
your answer .)
Tests: 82% 67% 93% 81% 73%
Quizzes: 80% 29% 91% 100% 54% 82% 100%
Final: 83%
34. The class average on a math test was 82 out of 100.
The 11 girls in the class scored 966
points. How many total points did the 8 boys score?
35. Jeff scored 76, 82, 69, 87, 90 on his first 5 math
tests. What score must he get on his 6th
test to have a mean of 83%?
36. Line graphs with scale changes can be deceptive .
A) True
B) False
37. What is the 100th term in this sequence ? Look for a
pattern.
3, 8, 13, 18, 23, . . .
Answer 2 of the following as an essay in paragraph form.
Use examples as needed. Provide an
answer as if you were responding to the student as applicable.
1. Erik says that 3.25 > 3.5 because 25>5, and 6.2 < 6.04 because 2 < 4. Discuss. pg 427 # 5
2. Spike looks at the data 5, 6, 7, 8, 8, 9, 4, 9 and
tells you that the median is 8. Do you agree?
If not, how can you explain his misconception. pg 475 # 1
3. Michael collected data on the favorite colors of
everybody in the class. He then drew a line
graph of the data, but Rosa said he should have drawn a circle graph. Which
student was
correct, and why? pg 454 #2.
Answer Key
1. A
2. 4
3. 9
4. 1/125
5. -4/5
6. 11/15
7. 1/3
8. B
9. B
10. 12/7
11. 2
12. -5
13. rational
14. A
15. B
16. D
17. B
18. (-2, 4); (1, 3); (4, 0); (0, -2); (-5,-1)
19. -2;0
20. B
21. A
22. A
23. B
24. 300
25. A
26. B
27. B
28. B
29. C
30. A
31. 78
32. 25
33. 79.5
34. 592
35. 94
36. A
37. 498
| Prev | Next |