Graphing Linear Equations and Inequalities
5.2.3 Graphs of Equations in the form Ax +By =C
Steps to graph a linear equation in the form Ax +By =C
To graph a linear equation in the form Ax + By = C:
1. Solve
Ax + By = C for y. That is, isolate y to get the equation in
the form y = mx + b.
2. Graph by plotting three points.
i. Pick three values for x.
ii. For each x chosen in step i, use the equation from step i
( y = mx + b) to compute the three corresponding values of y .
iii. Plot the three ordered pairs and use a ruler to draw a line
through the points. Draw the line through the entire grid and
draw arrowheads at each end of the line to show that the line
continues indefinitely.
Example 10 Graph 2x + 3y = 6 by finding three solutions.
1. Solve the equation for y.
2. Compute three points and graph.
|
 |
3. Write the ordered-pair where the
graph intersects the x-axis.
4. Write the ordered-pair where the graph intersects the y-axis.
Example 11 Graph 2x - 5y =10 by finding three
solutions.
1. Solve the equation for y.
2. Compute three points and graph.
|
|
3. The x-intercept in a graph is the ordered-pair
(x, y) location
where the graph intersects the x-axis.
Write the x- intercept in the graph of 2x - 5y =10.
What is the value of the y-component of the x-intercept?
4. The y-intercept in a graph is the ordered-pair (x, y) location
where the graph intersects the y-axis.
Write the y-intercept in the graph of 2x - 5y =10.
What is the value of the x-component of the y-intercept?
5.2.4 Graph lines using the x- and y-Intercepts
Intercepts of a Curve (Graph)
The x-intercept of a graph is the point (ordered pair location) where
the graph intersects the x-axis. The y-intercept of a graph is the
ordered pair location where the graph intersects the y-axis.
Example 5
a. Identify the intercepts of each curve.
b. What is the y value of all x-intercepts? |
 |
||||||
Finding intercepts when given an equation.
1. All x-intercepts are in the form (a, 0), where a is a constant
[ number ]. To find the x-intercept, set y = 0 and solve for x.
2. All y-intercepts are in the form (0, a), where a is a constant. To
find the y-intercept, set x = 0 and solve for y.
Example 12
Find the x- and y-intercepts in the graph of
5x + 4y = 20. Then graph the line.
Solution
An x-intercept is in the form (?, 0). Thus, set y = 0 and find the
corresponding value of x.
A y-intercept is in the form (0, ?). Thus, set x = 0 and
find the
corresponding value of y.
|
Thus, the x-intercept is (4, 0) and the y-intercept is (0, 5). Now, graph the line using the intercepts. |
|
Example 13 Find the x- and y-intercepts of -3x + 7y
= 21 and
graph the line.
Example 15 Find the x- and y-intercepts of 3x - 4y
=12 and graph
the line.
Mentally finding an x-intercept
Recall, an x-intercept is in the form (___, 0). So, to find the xintercept
set y = 0 and solve for the x- coordinate . Then write the
intercept as an ordered-pair. Since setting y = 0 makes the term
containing y disappear, you can simply cover the “y-term” and
mentally solve for x. In the following illustration, the shaded-out
parts indicate the computations done mentally:
|
Conventional method of finding the x -intercept |
Mentally find the x-intercept |
|
 |
 x - int . is (-2,0) |
Since y = 0, the term containing y disappears. So, just put your finger over the y- term and mentally solve –4x = 8 to get x = -2. |
Thus the x-intercept is (-2, 0). Similarly, covering the
x-term will
allow you to mentally find that the y-intercept is (0, -8).
Example 16
Find the x- and y-intercepts in the graph of each equation.
| Equation Ax + By = C |
A | B | C | x-intercept (a, 0) |
y-intercept (0, b) |
 |
|||||
Equations & Graphs of Horizontal and Vertical Lines
|
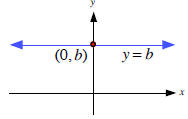
Horizontal Lines All horizontal lines have the equation y = b, where b is a constant. The y-intercept in the graph of y = b is (0, b). |
 |
|
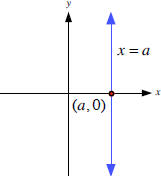
Vertical Lines All vertical lines have the equation x = a, where a is a constant. The xintercept in the graph of x = a is (a, 0). |
 |
|
Example 18 Graph each equation. Label each graph. a. x = -5 b. y = 7 c. x = 3 d. y = -1 e. What is the equation of line lying on the x-axis? f. What is the equation of the line lying on the y-axis? |
|
| Prev | Next |