Rational Functions
Abstract
This handout is a quick review of rational functions . It also contains
a set of problems to guide the student through understanding rational
functions. This is to be turned in on Monday March 25.
1 Definition and Examples
Definition 1 A rational function is a function of the form![]() where
where
P and Q are polynomials . We assume P and Q have no factors in common .
We notice immediately that r is not defined for every real number . The
domain of r is the set of real numbers which are not zeros of Q.
The notation x →  means that x is approaching
a and is larger than
means that x is approaching
a and is larger than
a. In other words, x is approaching a from the right. Similarly, the notation
x →  means that x is approaching a and is
less than a. In other words, x is
means that x is approaching a and is
less than a. In other words, x is
approaching a from the left.
Definition 2 (asymptote) Consider the function y = f (x).
1. The line x = a is a vertical asymptote for f if y →∞ or y →−∞ as
x → or x → .
2. The line y = b is a horizontal asymptote for f if y → b as x→∞ or
x→−∞.
A rational function has a vertical asymptote wherever its denominator is
zero but its numerator is not zero . In other words, the line x = a is a vertical
asymptote for some rational function, if and only if a is a zero of the
denominator
but not of the numerator . The graphs below illustrate the relationship between
a function and its asymptote.
In the graph below , the line x = 2 is a vertical asymptote. Here, we have
that y →−∞ as x →  and y→∞ as x →

In the graph below, the line x = 2 is a vertical
asymptote. Here, we have
that y→∞ as x → and y →−∞ as x →
In the graph below, the line x = 2 is a vertical
asymptote. Here, we have
that y→∞ as x → as x →
In the graph below, the line x = 2 is a vertical
asymptote. Here, we have
that y →−∞ as x → as x →
The four graphs above illustrate the four possibilities
for the behavior of a
function near its vertical asymptote. The graphs below
shows the behavior of
a function with respect to its horizontal asymptote. The horizontal asymptote
represents the behavior of a function when x → ±∞. In the graph below, the
line y = 2 is a horizontal asymptote.
Can you think of other possibilities for the position of a
function with respect
to its horizontal asymptote?
When a function y = f (x) has a vertical asymptote at x = a, it means that
it is not defined at x = a since a is a zero of the denominator. Therefore, we
cannot evaluate f (a). According to the definition of an asymptote, we know
that y → ±∞ as x → ±∞. The question is to know whether y is approaching
−∞ or ∞. In order to find the answer , we evaluate the function at values of x
closer and closer to a to see if we can detect a pattern. For example, consider
the function 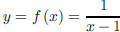 . We see that f is not defined
at x = 1. To find
. We see that f is not defined
at x = 1. To find
what y is approaching as x →  and x →
 , we plug into the function values
of x close to 1. Which values we try is not too important. What matters is that
we try values of x close to 1 and getting closer and closer. To see what happens
to y as x → , we might try 1.1, 1.01, 1.001, 1.0001. The table below helps us
with the answer.
We can see that as x gets closer to 1 from the right, y is
getting larger and
larger. This suggests that y→∞ as x → .
To see what happens to y as x → , we might try 0.9, 0.99, 0.999, 0.9999.
The table below helps us with the answer.
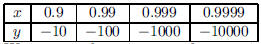
We can see that as x gets closer to 1 from the left, y is
getting larger and
larger in absolute value, but it is also negative . This suggests that y →−∞ as
x → .
Using the concepts above, answer the questions below.
1.1 Group work
Example 3 Consider  . Answer the questions below, explain your
answers.
1. What is the domain of f?
2. With the help of a table of values, determine the value f approaches when x
approaches ∞. An equivalent way of asking this is: find what f approaches
when x→∞.
3. Same question when x→−∞
4. Obviously, f is not defined at 0. We wish to study the behavior of f as
x approaches 0. x can either approach 0 from the right (x is larger than
0 and approaches 0), in this case we write x →
 . x can also approach
0 from the left (x is smaller than 0 and approaches 0), in this case we
write x →  . Using a table of values, determine what f approaches when
x → , when x →
5. Sketch the graph of f and its asymptotes.
Example 4 Consider  . Answer the questions below, explain your
answers.
1. What is the domain of g?
2. With the help of a table of values, determine the value g approaches when x
approaches ∞. An equivalent way of asking this is: find what g approaches
when x→∞.
3. Same question when x→−∞
4. Determine what g approaches when x → , when x →
5. Sketch the graph of g and of its asymptotes.
6. Questions 1 - 5 can also be answered by considering g as a transformation
of f (see 2.4). Show how you would do this by first determining which
transformation would produce g from f.
| Prev | Next |