Graphing Linear Equations
Section 3.1 Graphing Linear Equations
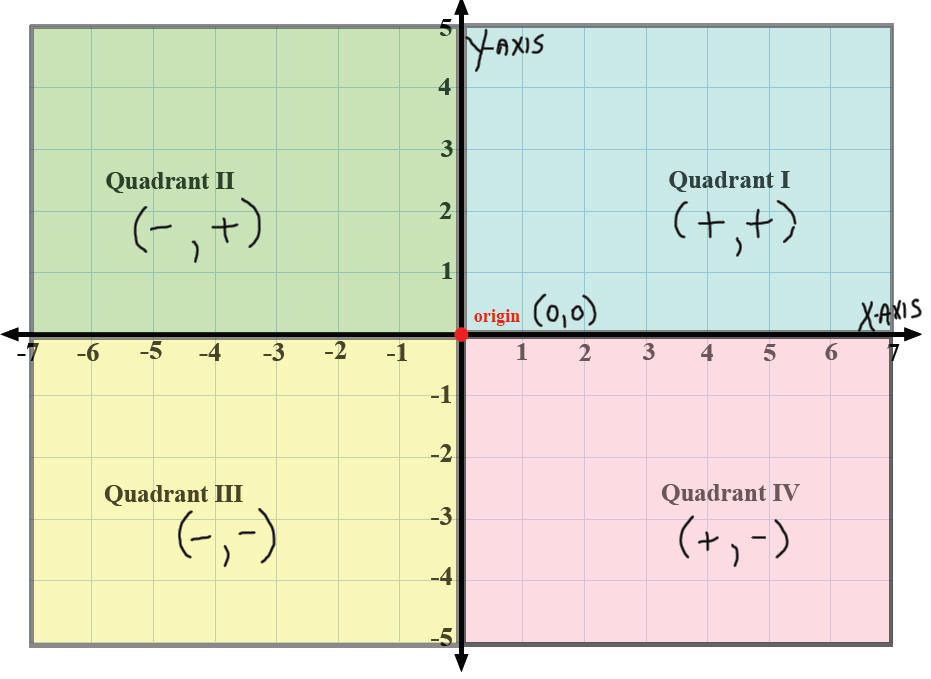
Section 3.1 The Rectangular Coordinate System
Any point on the plane can be described using two numbers , one number from
each axis , in what
is called an ordered pair .
to place your point.
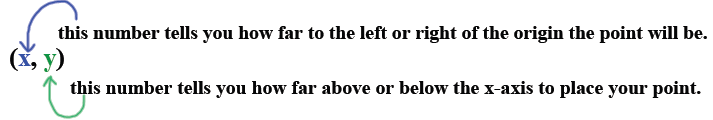
The number representing a point's horizontal distance from the origin (along the
horizontal xaxis) is given first (it is called the xcoordinate.)
The number representing the point's vertical distance from the origin (in the
direction of the vertical yaxis) is given second (it is called the ycoordinate)
To find the coordinates of a given point: (note: these are always written as an
ordered pair.)
Find the number on the xaxis that the point " lines up " with. That is the
xcoordinate.
Find the number on the yaxis that the point "lines up" with. That is the
ycoordinate.
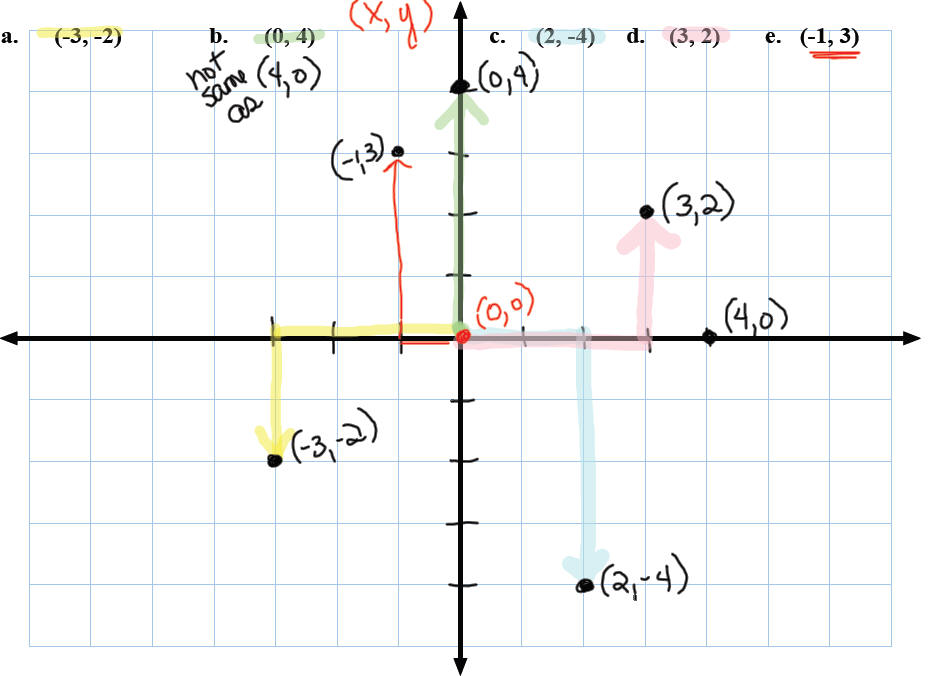
To "plot" or "graph" a point when given its orderedpair
(coordinates):
(note: the ordered pair describes only ONE point!)
Use the xcoordinate to align the point with the xaxis
(left or right from the origin.
Use the ycoordinate to align the point with the yaxis
(up or down from xcoordinate).
Ex. 1: Plot the point described by the coordinates and identify the point's
quadrant.
Definition: Linear equation in two variables : An equation that can be written in the form Ax + By = C (standard form), where A and B are not both 0.
| PLOTTING POINTS METHOD (3 POINTS on paper, MML only lets you plot 2 of them
Finding
solutions (ordered pairs)
|
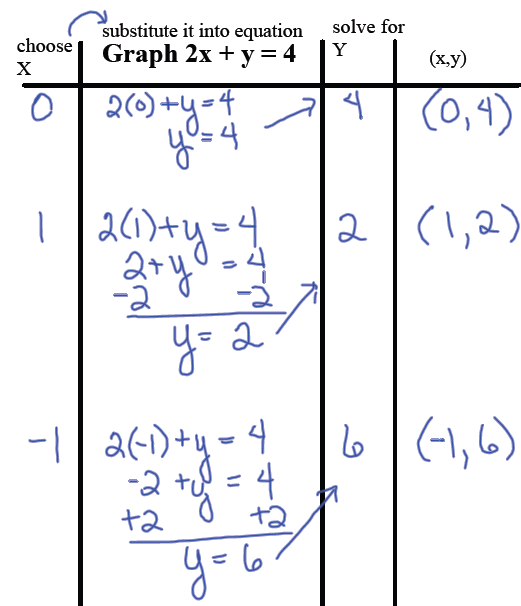 |
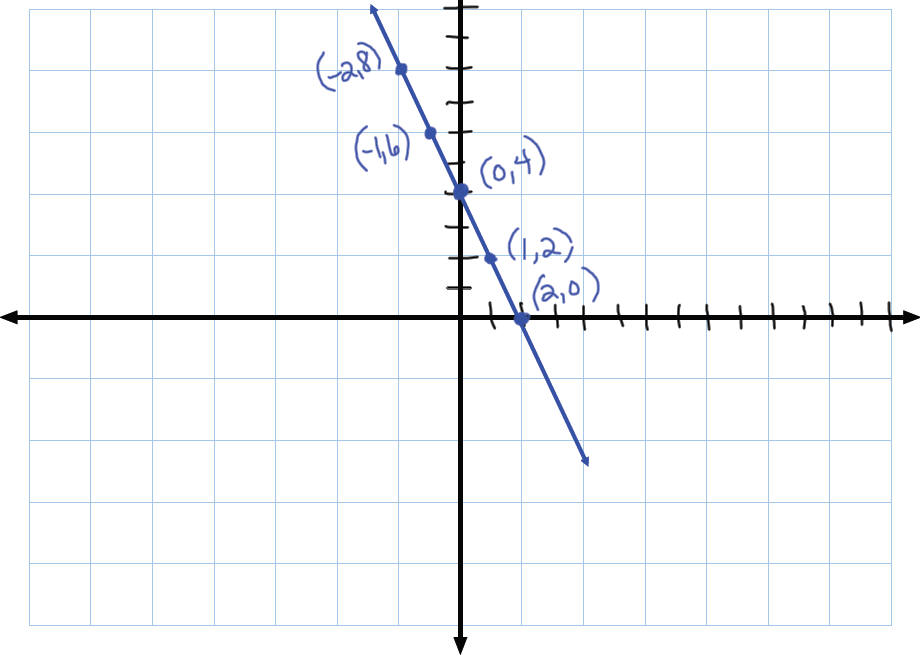
Graph 2x + y = 4
Definition: Linear equation in two variables: An equation that can be written in the form Ax + By = C (standard form), where A and B are not both 0.
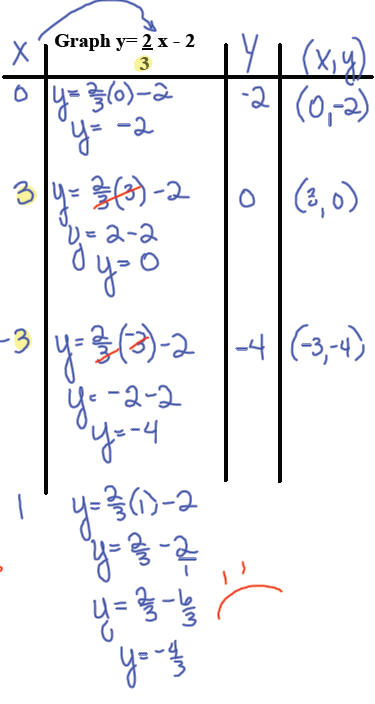
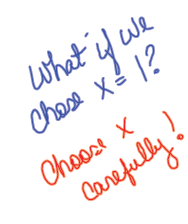
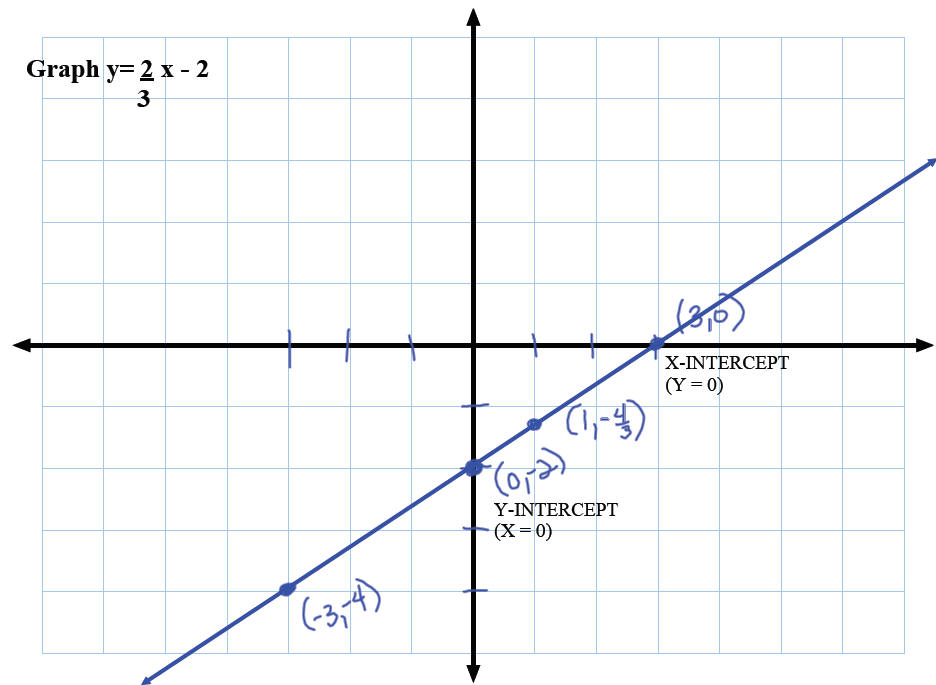
| PLOTTING POINTS METHOD (3 POINTS) Finding solutions (ordered pairs) and graphing equations with two variables: 1. Replace one of the variables (usually x) with any chosen number. If the xvalue you choose results in a fraction, you may choose a different value . 2. Solve the equation for the other variable. 3. Write the twovariable solution as an ordered pair. 4. Repeat until the desired number of orderedpair solutions are found.
|
 |
Definition: Linear equation in two variables: An equation that can be written in the form Ax + By = C (standard form), where A and B are not both 0.
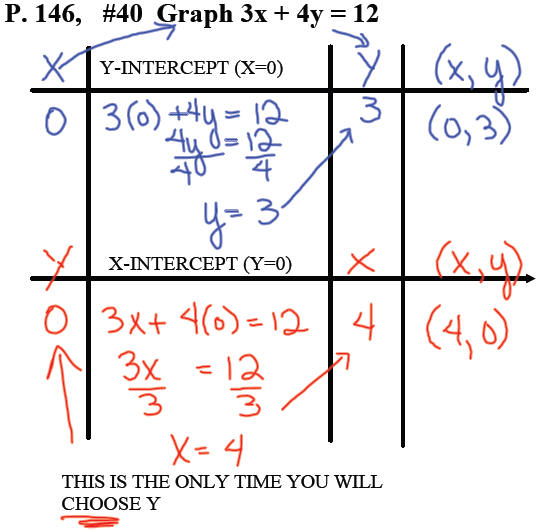
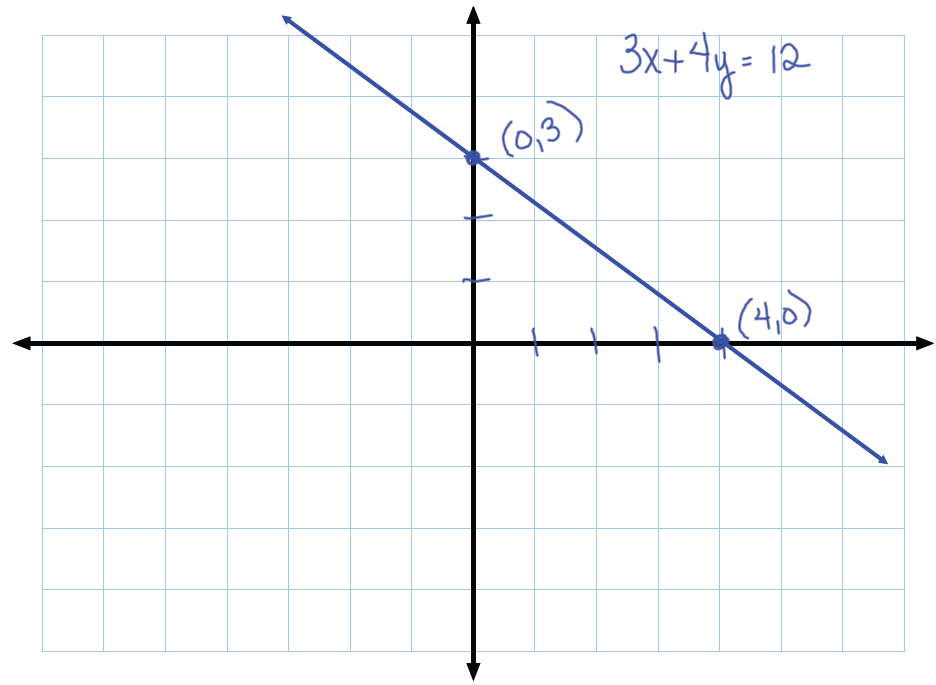
| INTERCEPTS METHOD (2POINTS) XINTERCEPT & YINTERCEPT Finding solutions (ordered pairs) and graphing equations with two variables: 1. Replace one of the variables (usually x) with any chosen number. If the xvalue you choose results in a fraction, you may choose a different value. 2. Solve the equation for the other variable. 3. Write the twovariable solution as an ordered pair. 4. Repeat until the desired number of orderedpair solutions are found.
|
 |
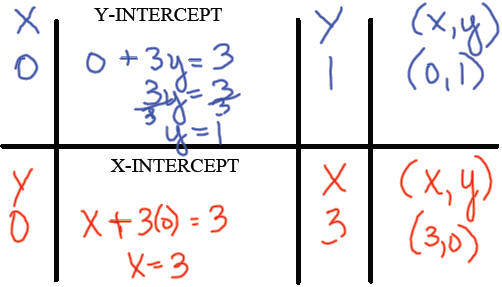
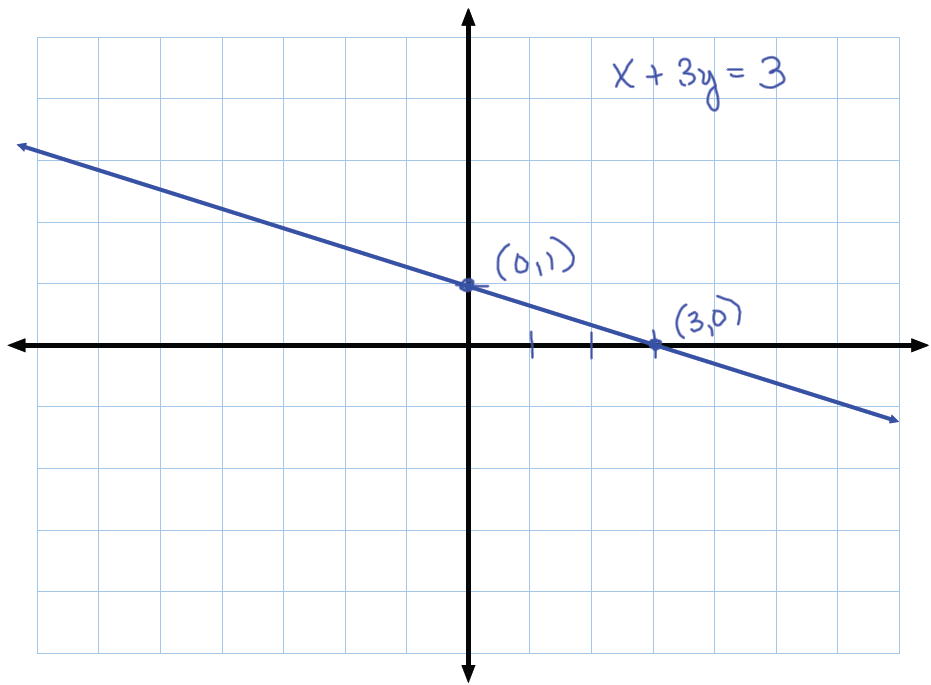
Example 3: Find the xand yintercepts and graph x + 3y = 3
| YOU TRY THIS ONE.... Finding the xintercept
|
 |
| Prev | Next |