Pre-Calculus Notes
Shifting Graphs Up and Down:
(Section 4:4 in JIT.)
Example: Let  , the absolute value of
x , so
, the absolute value of
x , so
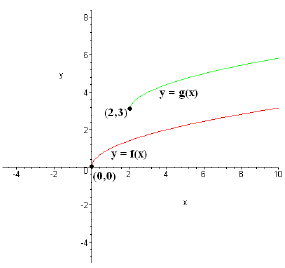
Suppose we look at the graph of f, and we want to shift the graph up by 3 units.
Our goal
will be finding the function g(x) whose graph is precisely that .
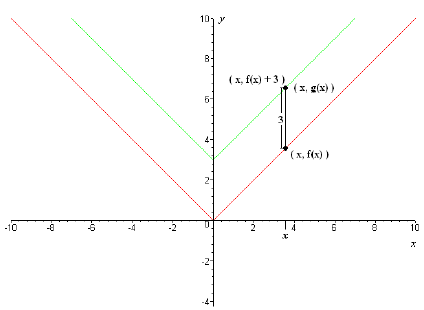
Sketch of  and y = g(x).
If we take any value x in f 's domain, and look at the corresponding point (x,
f(x)) on the
curve , we see that by going up 3 units, we get to the corresponding point on the
graph of g(x),
(x, g(x)). But that point's y- coordinate is f (x)+3, so the point (x, g(x)) is
the point (x, f(x)+3).
But for the points to be identical, their y- coordinates must be identical, so
g(x) = f(x)+3, which,
in this case means  , for all x in f's domain.
This idea works whether or not we used the number 3 or the number 5, or even the
number
-12, and is true for ANY function, not just

•To shift the graph of a function y = f(x) up by c units, you graph the function
y = f(x)+c.
•To shift the graph of a function y = f(x) down by c units, you graph the
function y = f(x) - c.
Shifting Graphs Left and Right:
(Section 4:5 in JIT.)
Now, let's look at the graph of f(x) = x2, and suppose we want to shift it to
the right by 2
units to get the graph of a new function, g(x):
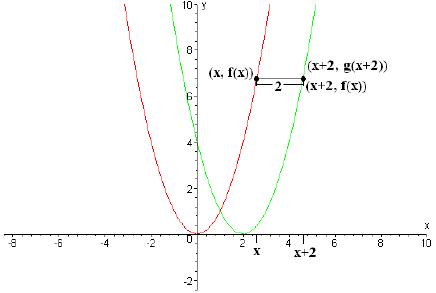
Sketch of y = x2 and y = g(x).
Again, looking at a point (x,f(x)) on f's graph, we see that by going right 2
units (increasing
the x-coordinate by 2), we get to the corresponding point on the curve of g (x),
(x + 2,65292; g(x + 2)).
But that point's y-coordinate value is f(x), so (x + 2, g(x + 2)) is (x + 2, f(x)),
and this holds
for any value of x. But, for the points to be identical, their y-coordinates
must be identical, so
g(x + 2) = f(x). This is true for any value of x, including x - 2: g((x - 2) +
2) = f(x - 2), so
g(x) = f(x - 2). As before, this pattern holds for all functions in a similar
way:
•To shift the graph of a function y = f(x) left by c units, you simply graph
the function
y = f(x + c).
•To shift the graph of a function y = f(x) right by c units, you simply graph
the function
y = f(x - c).
Be careful! When shifting up or down by c we add or subtract c , but when
shifting to the
left we have to add c and shifting to the right we subtract . They're slightly
different , so make sure
you appreciate that!
Shifting Graphs both Up (or Down) and Right (or Left):
(Section 4:6 in JIT)
We can combine shifting up/down and left/right by simply doing one, then the
other: to shift
the graph of f(x) up (or down) and then left (or right), just do the following:
1: Take the graph of y = f(x) and shift it up (or down), resulting in the graph
of a new
function, y = h(x).
2: Shift the graph of that new function h(x) left or right, resulting in the
graph of yet another
new function y = g(x).
The graph of y = g(x) is the solution . (In fact the order doesn 't matter: we
could shift left
or right ¯first, and then shift up or down. The end result will still be the
same.)
Example: Suppose we shift the graph of y = up 3 and to the right 2. Find the equation
of the new graph:
Solution: Let f(x) = , so that we can
just apply the 2- step process above: We first
shift the graph up 3, which, by what we've done already, gives us the graph of
the function
h(x) = f(x) + 3 = + 3. Then, we shift the graph of h(x) to the right by 2, which gives us the
function g(x) = h(x - 2) = + 3. So the graph of y = g(x), or y =
 + 3 is our desired
solution:
Sketch of y = f(x) = and y = g(x).
But now let's look at a slightly trickier problem:
Example: Graph the equation y = x2 - 6x + 4.
Solution: Rather than simply plotting points and hoping we get the right answer,
we can
be a bit more clever: we can complete the square !
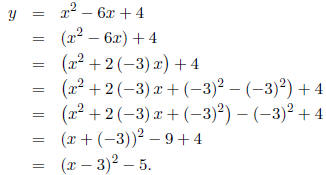
Why does this help us? Well, we've already seen how to graph y = x2, and y = (x
- 3)2 - 5
is the graph we'd get if we shifted y = x2 down by 5, and then right by 3:
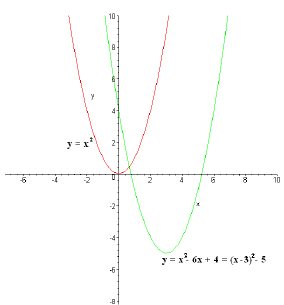
Sketch of y = x2 and y = x2 - 6x + 4.
| Prev | Next |